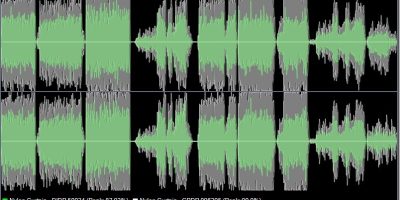
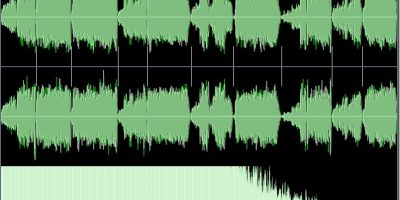
A recent improvement to the CDWaveform utility provides a spectral graph indicating the frequency makeup of the waveform. While it’s not the most useful measurement application, it does provide some reference when a CD has been EQ’d much differently between pressings. Viewed relative to other albums, you can get an idea of how much “top-end” an album might have compared to others.
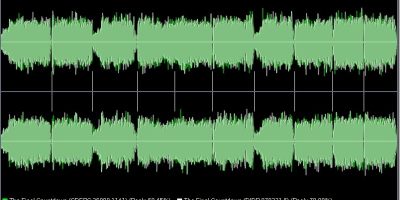
Some recent posts have shown an unusual amount of high-frequency in the spectrum graph, specifically:
- Billy Joel – The Bridge
- Scorpions – Love At First Sting
- Tom Petty And The Heartbreakers – s/t
- Laura Branigan – Branigan 2
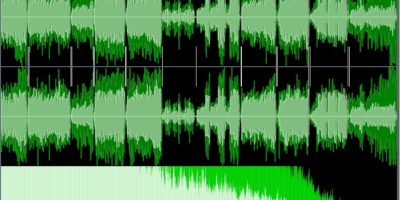
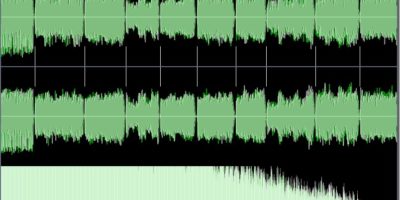
The only logical reason for such a excessive boost of the frequency is what is called pre-emphasis. In early CD mastering, some engineers would choose to apply “emphasis” to the high frequencies to overpower any existing hiss and to gain additional headroom. The CD player would apply a reverse equalization to pull those boosted frequencies back down to normal levels.
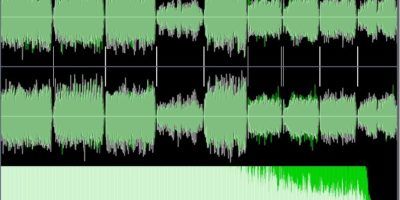
There are two ways the engineer can specify that the track has emphasis applied, either in the CD’s Table of Contents or embedded in the track itself. The latter was the most common and, with the exception of mastering errors, is the definitive source of whether the track has emphasis applied. Unfortunately, for about 10 years now, CD-ROM drives don’t read that embedded data anymore. However, the flag in the Table of Contents is accessible. The problem is that it may not always be set.
I’ve made some improvements to the CDWaveform utility to identify when a CD has pre-emphasis, but I can only do it based on the Table of Contents, not from the tracks themselves. So, when I definitely know a CD has emphasis added, I’ll put that in the comments. But if it doesn’t say so, but the spectrum graph shows a large boost in the high frequencies, you can safely assume that emphasis is added.
Leave a Reply